Hi,
Some tests later:
GUtils.register();
This line of code cases the following exception:
    java.lang.UnsatisfiedLinkError: No implementation found for org.moe.GCUtil org.moe.GCUtil.alloc() (tried Java_org_moe_GCUtil_alloc and Java_org_moe_GCUtil_alloc__)
        at org.moe.GCUtil.alloc(Native Method)
        at org.moe.GCUtil$Holder.<clinit>(GCUtil.java:35)
        at org.moe.GCUtil.register(GCUtil.java:23)
        at org.moe.samples.elements.ios.Main.applicationDidFinishLaunchingWithOptions(Main.java:67)
        at apple.uikit.c.UIKit.UIApplicationMain(Native Method)
        at org.moe.samples.elements.ios.Main.main(Main.java:52)
Maybe a missing ’ @Selector(“alloc”) ’ above ’ public static native GCUtil alloc(); ’ in the GCUtils!
Keeping in mind that the GCUtils wont work I continued testing the Taxi example and the latest MOE version.
I profiled the updated Taxi example and the memory usage still increases (not that fast as before, but it still increase).
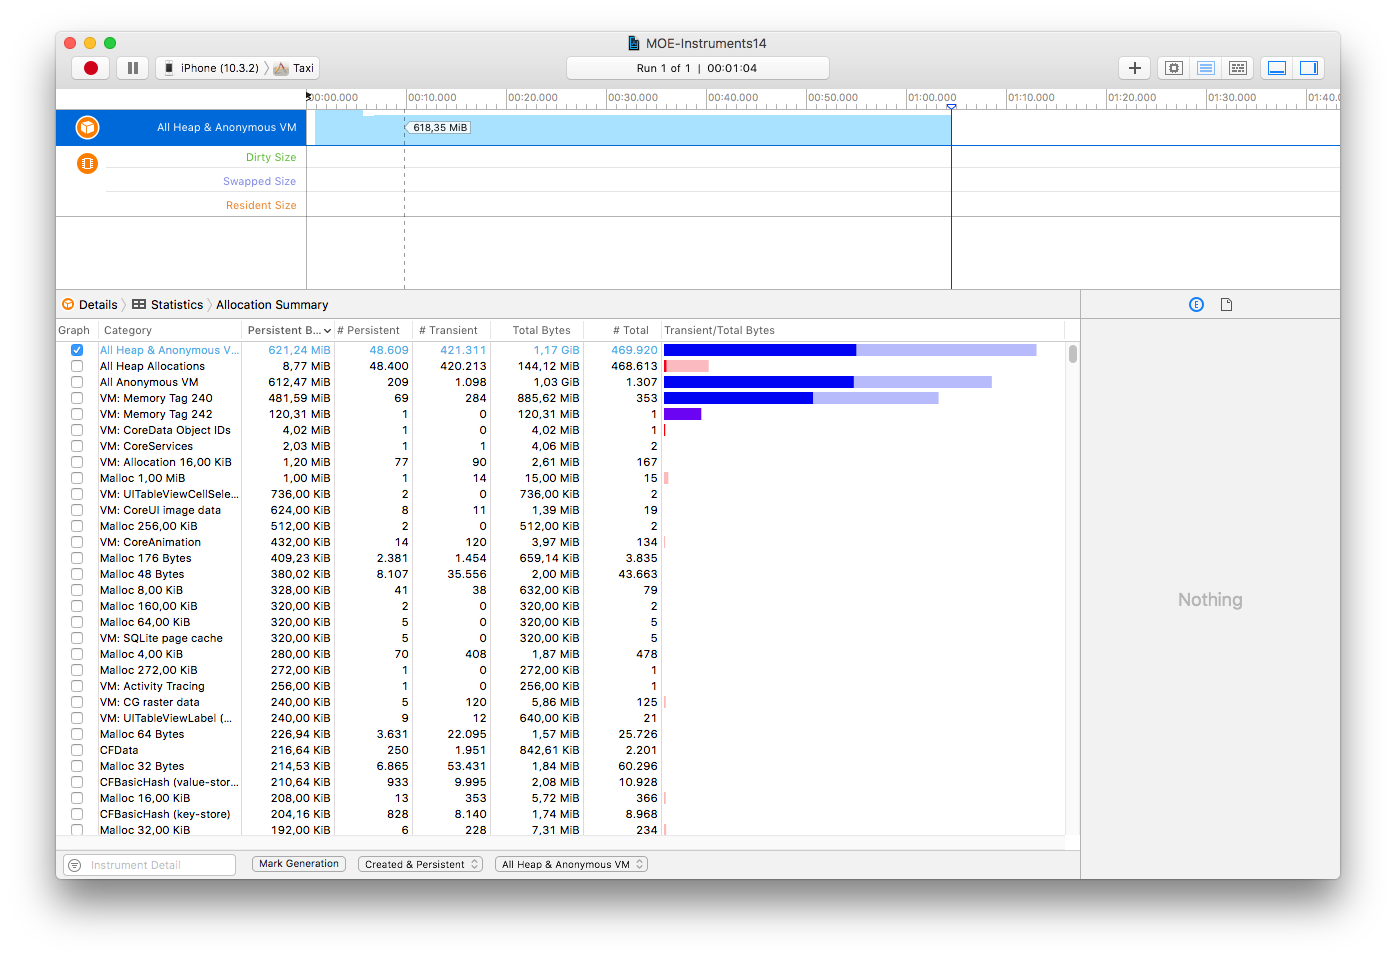
The following images are showing the memory usage while profiling the Taxi example.
On Start (618.35 MiB):
After 1 Minute (621.24 MiB):
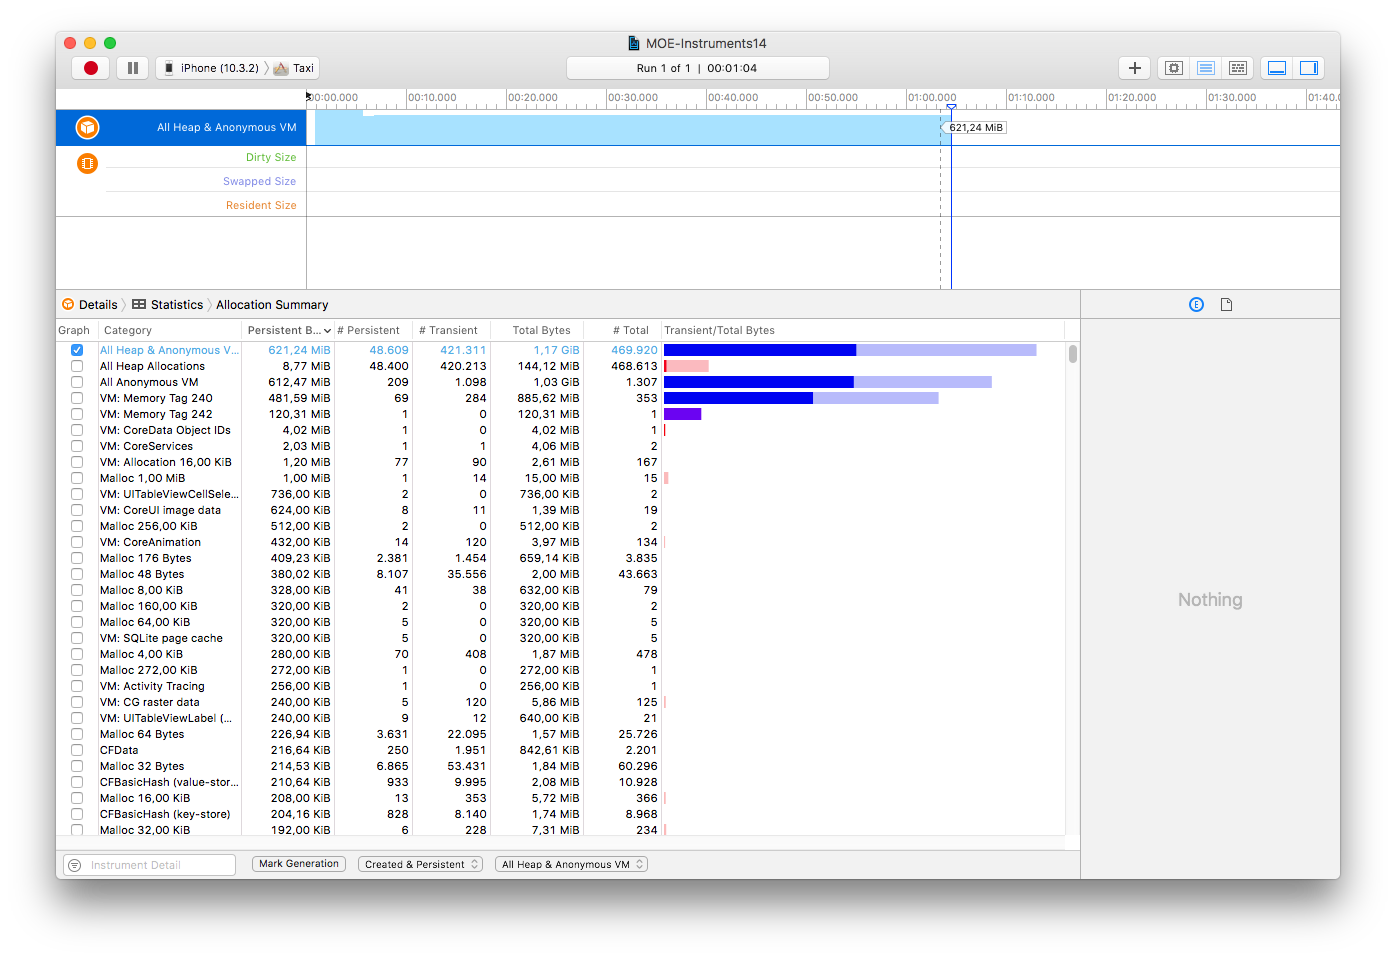
Comparing these results with the measurement which I made before I can clearly see an improvement.
So I decided to implement these changes also in my own application - but it still increases too fast and too much.
In fact I tested more to get a better overview about the memory management.
Looking deeper in your code and changes from the Taxi example, I decided to transfer these changes also to another example called The Elements.
I chose this example because the navigation and the view hierarchy it is more identical to my own application.
What I did:
- Added missing @Owned annotations
- Call ‘java.lang.Runtime.getRuntime().gc();’ in ElementsTableViewController’s ‘viewWillAppear’
- Implement AtomicElementViewController’s ‘viewDidDisappear’ and ‘viewWillAppear’.
- Marked problems as TODOs. So you can easily find as problematical identified code.
- Added some comments to explain what I did.
- Checked some delegates and nulled them if needed.
TheElements-Example.zip (644.7 KB)
Small summary:
While profiling the The Elements app I realized (as expected) a significant rise of the memory usages.
After the transfer the changes from the updated Taxi example the The Elements app still shows the same significant rise of memory usages. Looking through the code I recognized a typical situation for a retain cycle (this normally shouldn’t matter if you work with the java garbage collection). A view object held a strong reference to the view controller and the view controller held one to the view. If the view controller gets removed from the view hierarchy it would be released and normally its view(s) also. The cycle prevent that. I “fixed” that part by removing the view’s strong reference to the view controller on ‘viewDidDisappear’ and the memory seems to be more cleaned up now. But a slowly increasing memory usage is still noticeable (like the updated Taxi example).
As additional information to others:
I have a UITabBarController (like in The Elements) as my root controller.
The most interesting part about this is: in generell the UITabBarController keeps any of its view controller in the memory, even if the view controller is not visible. In fact with any additional controller on the UITabBarController the memory usage rushes quickly to its limit (keep in mind that even a simple MOE application currently has a high initial memory usage). Even without memory release problems the high initial memory usage could cause some unexpected side effects and time-critical work arounds.
As a result:
The applications still get killed by the system after some time (1 - 5 minutes).
I really need help to get rid of the high memory usage.
The memory problem in combination with the described retain cycle seems relevant and I need a statement on this.
Especially I need to know what exactly prevents the memory release in this case.
Best Regards,
Jucl