[solved] Huge RAM usages prevents app release

Hi MOE Team,

I’ve developed an iOS application based on MOE.
The application is now mostly stable and ready for release, but:
Based on the huge RAM usage of MOE as shown here High RAM Usage in MOE my application is beeing killed by the iOS system in less than a minute of usage.
This prevents my company from an app release and we need help to solve this problem.

Looking through the forum and some advices from other users later:
I modified the main.cpp as described here: Intel Moe Project Porting Problem and carefully call “Runtime.getRuntime().gc()” at some critical points, which did not really help.
So I decided to create a small sample project with an UINavigationController as RootView. As RootController I took a simple view controller with a single button on it which navigates the user on tap to a table view controller displaying small (24*24) images in each row.
While profiling the sample application I recognized that the table view controller stays in memory although it gets popped from the navigation stack.
Even with this small sample the system kills the application in less than 1,5 minutes of usage (just repeat navigating forward and backward with such an example to verify this behavior).
Now I wrote this sample in Objective-C - just to exclude a retain cycle problem - and the application behaved normal, even with a look at the RAM usage.

With this in mind I tested some of your sample applications / source codes.
Even your samples behave as my small project and will be killed after a few minutes of usage (to be sure that I did not messed around with my own example).

Looking at the screenshots from here High RAM Usage in MOE I saw that the MOE itself needs up to 600MB RAM. I know that an iPhone 4s (a 32 bit system) has just 512MB RAM.
So i decided to test my sample application on an iPhone 4s and profiled it in detail.
The application happily runs ( with a 498MB RAM usage after app launch) and wont get killed immediately, but it behaves as explained above (just for additional information for you and others).

It would be great if you could tell me how to get rid of the high RAM usage (which is mostly caused by MOE, see here again High RAM Usage in MOE) to release our application as quick as possible.

Best Regards,

Jucl
2 Likes

Hi,

could you please confirm that you are using the latest MOE SDK and moe-gradle (1.3.9) plugin?

Which sample apps did you try that exhibited the same problem? Could you please share your small PoC sample app so we can test it ourselves?

Manual GC should only be required in extreme circumstances (e.g. large native data structures are manipulated from Java in tight loops and the garbage Java binding objects are not freed quickly enough by the GC (because the GC does not see the memory pressure - it only sees the tiny Java allocations, not the huge native structures).

Best Regards,
Gergely

Hi Gergely,

We use the latest versions (MOE SDK and moe-gradle 1.3.9) and also tested multiple older versions with the same result.

I think the easiest way to reproduce the described problem is your example “Taxi”.
Profile this application on a real iOS device and look at the memory usage while navigating forward and backward (go in the map view and back navigate back).
You should see a constantly increasing memory, although you expect a big memory release on the back step.
The constantly increasing memory in combination with the high memory usage (~ 600MB on application start) brings the application quickly to its memory limit.

I can’t send you a small test project, because I’m currently in vacation and I have a bad internet connection. I’ll ask some co-workers, but don’t expect a quick response - sorry for that.

It would be very interesting to know what exactly cases the huge memory usage on the application start. Is it the JVM itself? (I refer to this High RAM Usage in MOE - the user compares MOE directly with RoboVM (total RAM usage ~7MB))

Best regards,
Jucl

We had memory leak issues, as we missed some @Owned annotations and used the wrong api to trigger gc. See also this topic: Heap dump of the JVM Maybe this is your issue as well?

Hi,

We will take a look at the Taxi sample.

Best Regards,
Gergely

Check this thread.

Hi,
we already raed about a Problem with the @Owned Annotion, but it was not really helpfull.
The thread from noisyfox seems pritty interesting and promising. I’ll take a detailed look at it and check it twice. This may take some time. I’ll give you feedback.
Thanks,
JayC

We released a new version (moe-gradle 1.3.10 with the associated SDK 1.3.7) that includes a GCUtil class that helps mitigate this issue. It is similar to what RoboVM is doing by default: it registers for iOS memory warnings and forces the execution of the GC. It also has a feature to force the GC periodically.

We also updated the Taxi sample to demonstrate the usage of GCUtil, along with a pattern to set the delegates to null when the viewWillDisappear() lifecycle method is called.

Please take a look at these changes and check if you can use them to fix the issues in your app as well.

Best Regards,
Gergely

1 Like

Hi,
We are still struggling with this issue.
I’ll give you more information the following week (after testing the new moe version).

Best Regards,
Jucl

Hi,

Some tests later:

    GUtils.register();

This line of code cases the following exception:

    java.lang.UnsatisfiedLinkError: No implementation found for org.moe.GCUtil org.moe.GCUtil.alloc() (tried Java_org_moe_GCUtil_alloc and Java_org_moe_GCUtil_alloc__)
        at org.moe.GCUtil.alloc(Native Method)
        at org.moe.GCUtil$Holder.<clinit>(GCUtil.java:35)
        at org.moe.GCUtil.register(GCUtil.java:23)
        at org.moe.samples.elements.ios.Main.applicationDidFinishLaunchingWithOptions(Main.java:67)
        at apple.uikit.c.UIKit.UIApplicationMain(Native Method)
        at org.moe.samples.elements.ios.Main.main(Main.java:52)

Maybe a missing ’ @Selector(“alloc”) ’ above ’ public static native GCUtil alloc(); ’ in the GCUtils!


Keeping in mind that the GCUtils wont work I continued testing the Taxi example and the latest MOE version.

I profiled the updated Taxi example and the memory usage still increases (not that fast as before, but it still increase).
The following images are showing the memory usage while profiling the Taxi example.

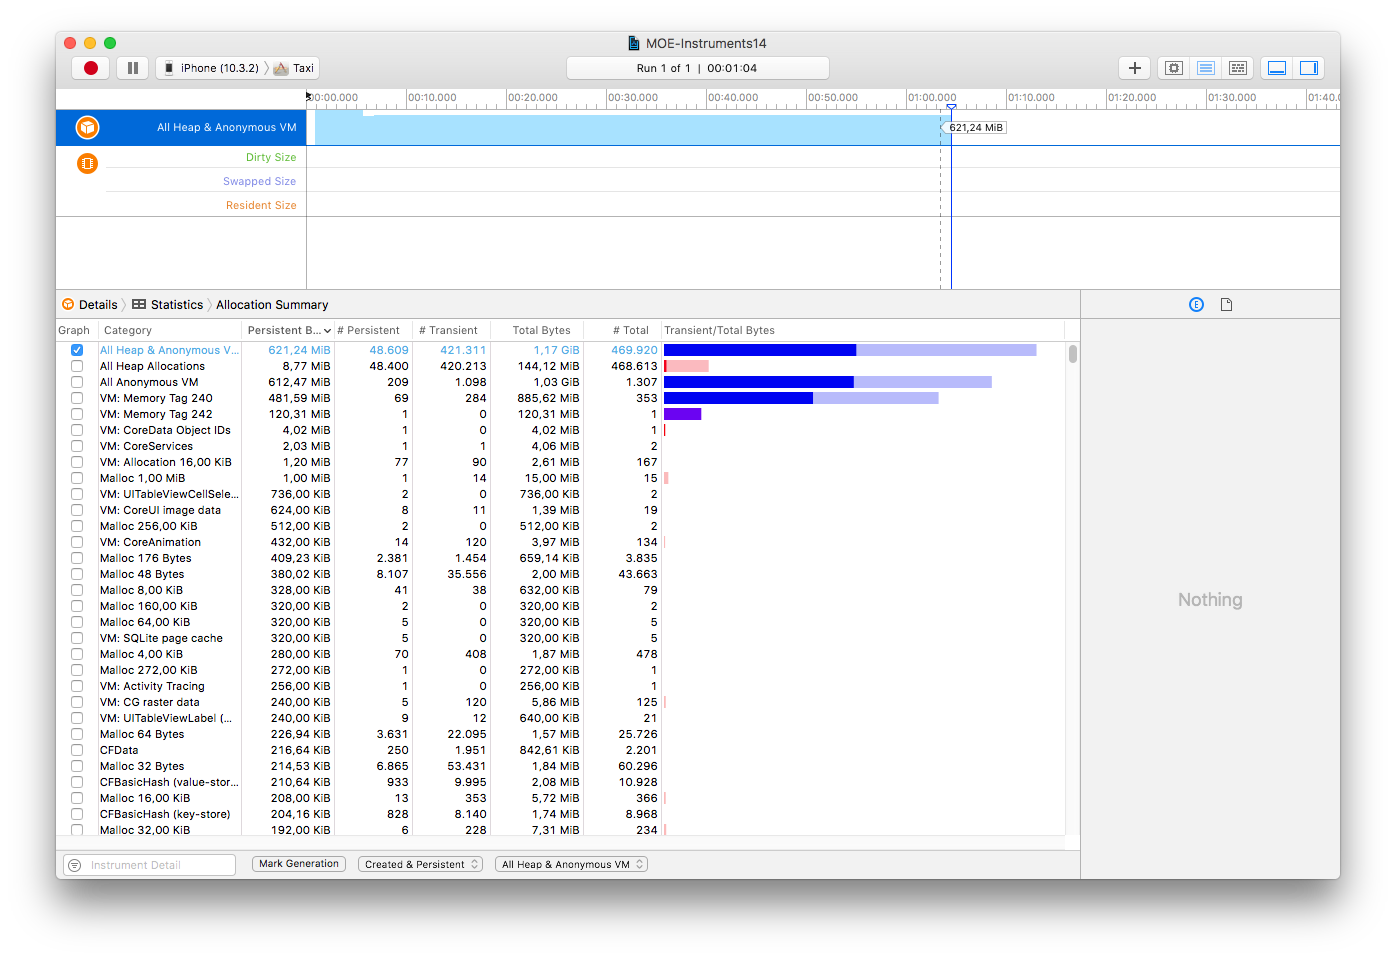
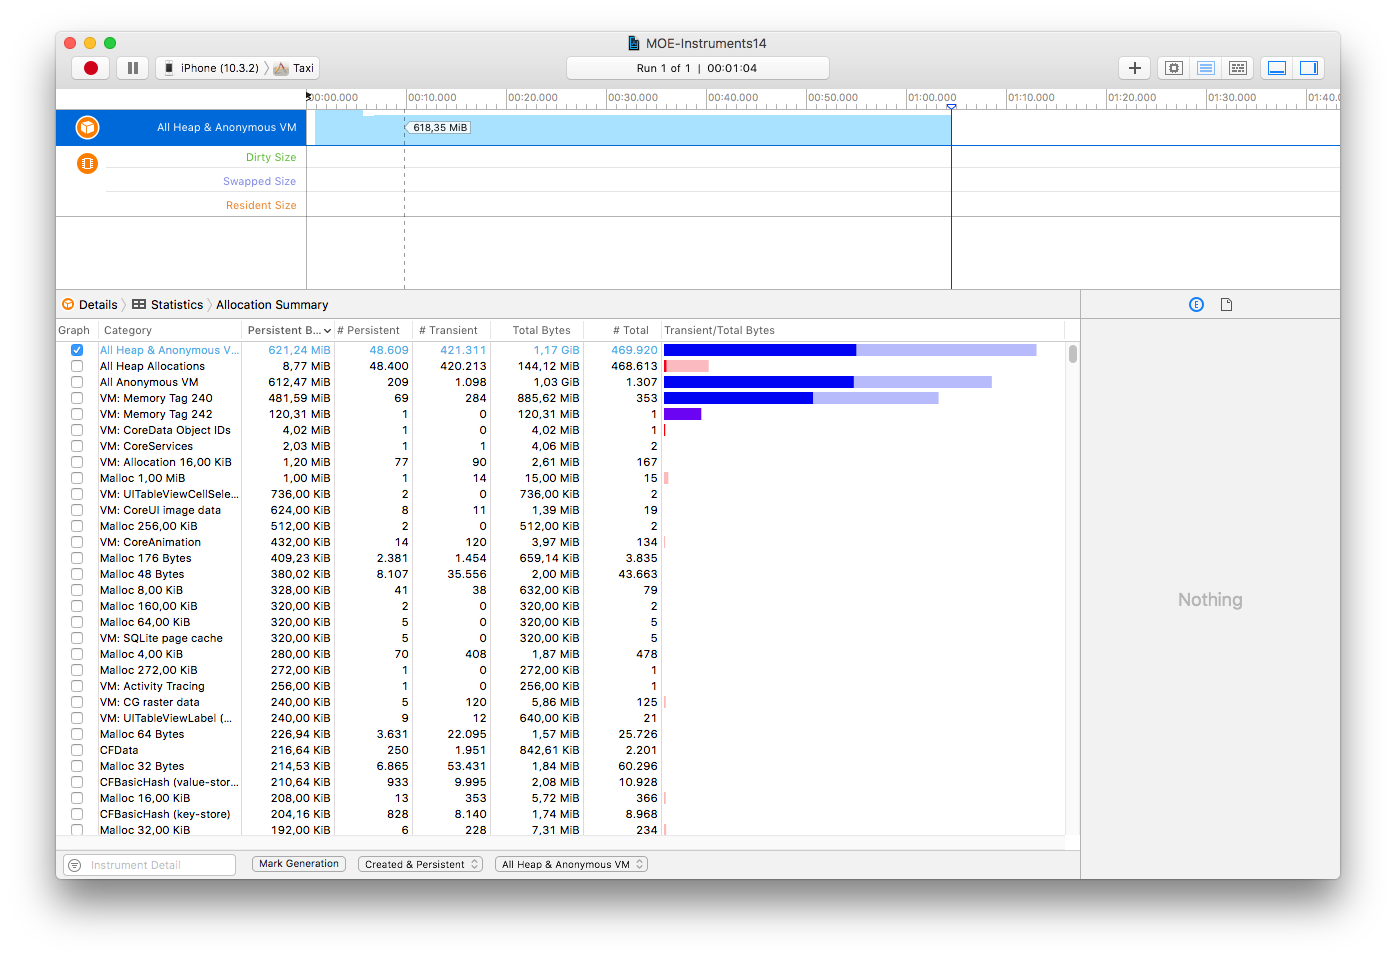
On Start (618.35 MiB):

After 1 Minute (621.24 MiB):

Comparing these results with the measurement which I made before I can clearly see an improvement.
So I decided to implement these changes also in my own application - but it still increases too fast and too much.
In fact I tested more to get a better overview about the memory management.


Looking deeper in your code and changes from the Taxi example, I decided to transfer these changes also to another example called The Elements.
I chose this example because the navigation and the view hierarchy it is more identical to my own application.
What I did:

  1. Added missing @Owned annotations
  2. Call ‘java.lang.Runtime.getRuntime().gc();’ in ElementsTableViewController’s ‘viewWillAppear
  3. Implement AtomicElementViewController’s ‘viewDidDisappear’ and ‘viewWillAppear’.
  4. Marked problems as TODOs. So you can easily find as problematical identified code.
  5. Added some comments to explain what I did.
  6. Checked some delegates and nulled them if needed.

TheElements-Example.zip (644.7 KB)

Small summary:
While profiling the The Elements app I realized (as expected) a significant rise of the memory usages.
After the transfer the changes from the updated Taxi example the The Elements app still shows the same significant rise of memory usages. Looking through the code I recognized a typical situation for a retain cycle (this normally shouldn’t matter if you work with the java garbage collection). A view object held a strong reference to the view controller and the view controller held one to the view. If the view controller gets removed from the view hierarchy it would be released and normally its view(s) also. The cycle prevent that. I “fixed” that part by removing the view’s strong reference to the view controller on ‘viewDidDisappear’ and the memory seems to be more cleaned up now. But a slowly increasing memory usage is still noticeable (like the updated Taxi example).

As additional information to others:
I have a UITabBarController (like in The Elements) as my root controller.
The most interesting part about this is: in generell the UITabBarController keeps any of its view controller in the memory, even if the view controller is not visible. In fact with any additional controller on the UITabBarController the memory usage rushes quickly to its limit (keep in mind that even a simple MOE application currently has a high initial memory usage). Even without memory release problems the high initial memory usage could cause some unexpected side effects and time-critical work arounds.


As a result:
The applications still get killed by the system after some time (1 - 5 minutes).
I really need help to get rid of the high memory usage.
The memory problem in combination with the described retain cycle seems relevant and I need a statement on this.
Especially I need to know what exactly prevents the memory release in this case.

Best Regards,
Jucl

Hi

You could look deep inside the java heap by creating heap dump just like I did since the Xcode doesn’t show you what’s going on inside the java vm.

Add

	<key>UIFileSharingEnabled</key>
	<true/>

to your info.plist and use

	@Selector( "dumpHeapAction:" )
	public void dumpHeapAction()
	{
		String dumpName = String.valueOf( System.currentTimeMillis() );
		dumpName = "MOE-Dump-" + dumpName + ".hprof";

		NSArray nsa = NSFileManager.defaultManager().
				URLsForDirectoryInDomains(
						NSSearchPathDirectory.DocumentDirectory,
						NSSearchPathDomainMask.UserDomainMask );
		NSURL docDirURL = ( NSURL ) nsa.firstObject(); // Error handling is for cowards :)
		String fsPath = docDirURL.fileSystemRepresentation();
		try
		{
			VMDebug.dumpHprofData( new File( fsPath, dumpName ).getAbsolutePath() );
		}
		catch( IOException e )
		{
			e.printStackTrace();
		}
	}

to generate a dump file which you can get through iTunes (if it’s running on real device).

Remember to open this file in android studio since this is created by android’s ART and the format is slightly different from the normal java heap dump.

Hi Jucl,

thanks for the detailed report, we are looking into it.

Best Regards,
Gergely

Hi!

We released a new version moe-gradle 1.3.11, fixed GCUtil build error and updated Taxi sample.

Best Regards,
Roland

Hi,
After looking through some heap dumps I couldn’t say that there is the situation, object or line of code which causes a memory leak.

Handling the object lifetime in viewDidDisappear() mostly helps for some ViewControllers.
The used memory is often completely released and it seems like that the memory leaks are mostly gone.
Turning off the debug, info and warning logs of some libraries also had reduced the generell memory usage.

I still see some problems regarding the high memory usage during the app start. A MKMapView rapidly increases the memory usage by ~30MB. Zooming and scrolling inside it will increase the memory usage even furhter. This behavior takes an iPhone 4s quickly to its memory limit.
Going further it is often not necessary to reach the total amount of memory to get killed by the iOS System. This question on stackoverflow shows the limits of some devices and underlines the need to improve the high memory usage from MOE.

I removed as many images as I could and tried to avoid loading to much ViewControllers but the app still gets killed by the system over time, which is definitely caused by the high memory usage.

Best Regards,
Jucl

Dear Jucl,

thank you for the detailed update.

One option that you have is to try and reduce the maximum heap size allocated to the MOE VM. You can do it with a simple modification in main.cpp:

In this other thread the maximum heap size was actually increased. I recommend that you try with -Xmx24m to see if it is enough for your app, and whether it reduces the memory usage that you see.

Best Regards,
Gergely

2 Likes

Dear Gergely,

That reduced the used memory to ~450 MB (without “-Xmx24m” ~650MB) on my iPhone SE.
This could be the solution. I’ll play with that number to get the best result.
My team is going to check that also on other devices.
I’ll give you feedback.

Here the code from “main.cpp” :

#include <string.h>
#include <alloca.h>

int main(int argc, char *argv[]) {
    char** argv2 = (char **)alloca(sizeof(char*) * (argc + 1));
    argv2[0] = argv[0];
    argv2[1] = strdup("-Xmx24m");
 
    for (int i = 1; i < argc; ++i) argv2[i + 1] = argv[i];
 
    return moevm(argc + 1, argv2);
}

Best Regards & Thanks,
Jucl

1 Like

Jucl,

Did this solve the problem you were having?

Hi,

After checking other devices, we can say that reducing the maximum java heap size helped a lot to increase the stability of our app and we did not recognize any crash yet!

Thanks Gergely, the idea was simple and effective!

All in all our (iOS) app does not need more than 12MB heap size in general.
Just in certain cases the app needed up to ~17MB.
As a result starting the VM with “-Xmx24m” should be enough.

By the way our iOS app written with MOE isn’t one of the smallest and we often show images (256x256 and bigger). The default maximum heap size which MOE uses to setup the VM seems far to high. In fact the remaining memory is to less for a stable application, especially if you use Apples UIKit or MapKit.

Thanks to all - you helped us a lot!

Best Regards,
Jucl

Hi,

this is certainly good news, thanks for sharing. We will consider reducing the default heap size in a future release.

Best Regards,
Gergely

Hi,

I’m not sure if its the case. Is it possible to MOE to use 32-bit Java runtime instead of 64-bit? I had some problems using Java in my notebook where Eclipse was taking 700MB and Android Studio was taking up to 3GB. I replaced Java and all the apps with the 32-bit version and all allocations dropped to the half: Eclipse takes 400mb and Android Studio up to 1.1GB.