My app crashes on iOS after some usage. The memory usage reported by Xcode is around 100 MB at this point.
The heap size of the JVM is only 7 MB for the full duration of the run. The JVM heap is almost entirely used at one point, but the garbage collector can free about 2.75 MB then. At the time of the crash there was still 2MB of JVM heap free.
So I suspect that the some Java objects referencing iOS objects are not freed by the garbage collector. Is there a way to get a heap dump of the JVM so I can see which objects are not garbage collected?
Hi, we also experiencing some issues with stability.
An an easy way to discover leaks is Xcode instruments leak detector.
There you can see what was lost during your app lifetime.
For the most intensive numbers I recommend hand-disposing MOE objects by calling
class ObjCRuntime
public static void disposeObject(Object object)
If you have many objects, I also highly recommend to use native objects as long pointer instead of java class so that
it is much faster (MOE object wraps Pointer, which in turns wraps the pointer, 2x times indirection and fwe virtual calls)
it is direct control, like RC (or ARC): retain-release
it takes significantly less memory
it does not require NSObject<->Java object mapping during methods dispatch
Example:
long nsText = ObjCRuntime.createNativeString(text);
// work with native nsText pointer to NSString
ObjCRuntime.releaseObject(nsText);
I tried that and initially I saw quite a bit of leaks. But then I added a call to System.gc() and I saw the amount of leaks drop significantly. Now I see about 60 leak locations. The location that has leaked the most has leaked 2 kiB, so in total not even 120 kiB is reported as having been leaked. Taking into account that some of these leaks are objects held by Java objects, I think the leakage is minimal.
No, this is a very basic application with at most dozens of views on a single screen.
Here are some more details about what I am seeing. I switch between 3 different screens. Every time I switch to a new screen (i.e. the root view of the window of my application delegate is changed), I see an increase of about 3 MB in real mem. Once this reaches 100 MB, it no longer increased, and even goes down to 94 MB sometimes. When I continue switching screens, the app crashes at some point. So the screens work fine many times, but suddenly there is a problem.
I see the same memory increase in the debugger graph. When the app crashes, the debugger stops with an EXC_BAD_ACCESS fault. I assume this fault is due to our code not checking for null properly and passing a null received from an API call to the next API call.
To help with your specific case, we would need to see the code (or a test case that shows the same symptoms).
In general, Nat/J bindings take care of memory management. There are a few corner cases, where memory management is not intuitive for the Java developer. Some of these are documented in the Nat/J docs.
There are some cases, where a relatively small number of Java binding objects cause the system to allocate large chunks of memory on the native side. The problem with this is, that the Java heap itself will not fill up, but the native heap usage can rise quickly to the point where iOS kills the app or it crashes.
This is not that frequent, it only happened to us, when we were allocating large texture buffers very quickly (high resolution video playback on an OpenGL texture). In such cases, while there is no direct memory leak, new chunks are allocated faster than the finalizer thread can deal with the old ones. This is why the ObjcRuntime.disposeObject API was born. It essentially frees the native part of a binding object: the Java object will be dealt with by the GC.
We also saw some cases, where the Java objects (e.g. ViewController) were somehow kept around, and thus the larger native allocations were also kept around.
As I wrote in the beginning: it is hard to help without seeing the code.
I never call an unsafe method in my code. But I do need to explicitly manage objects returned by Core Graphics functions that contain Create, Copy or Alloc in the name, right? For example:
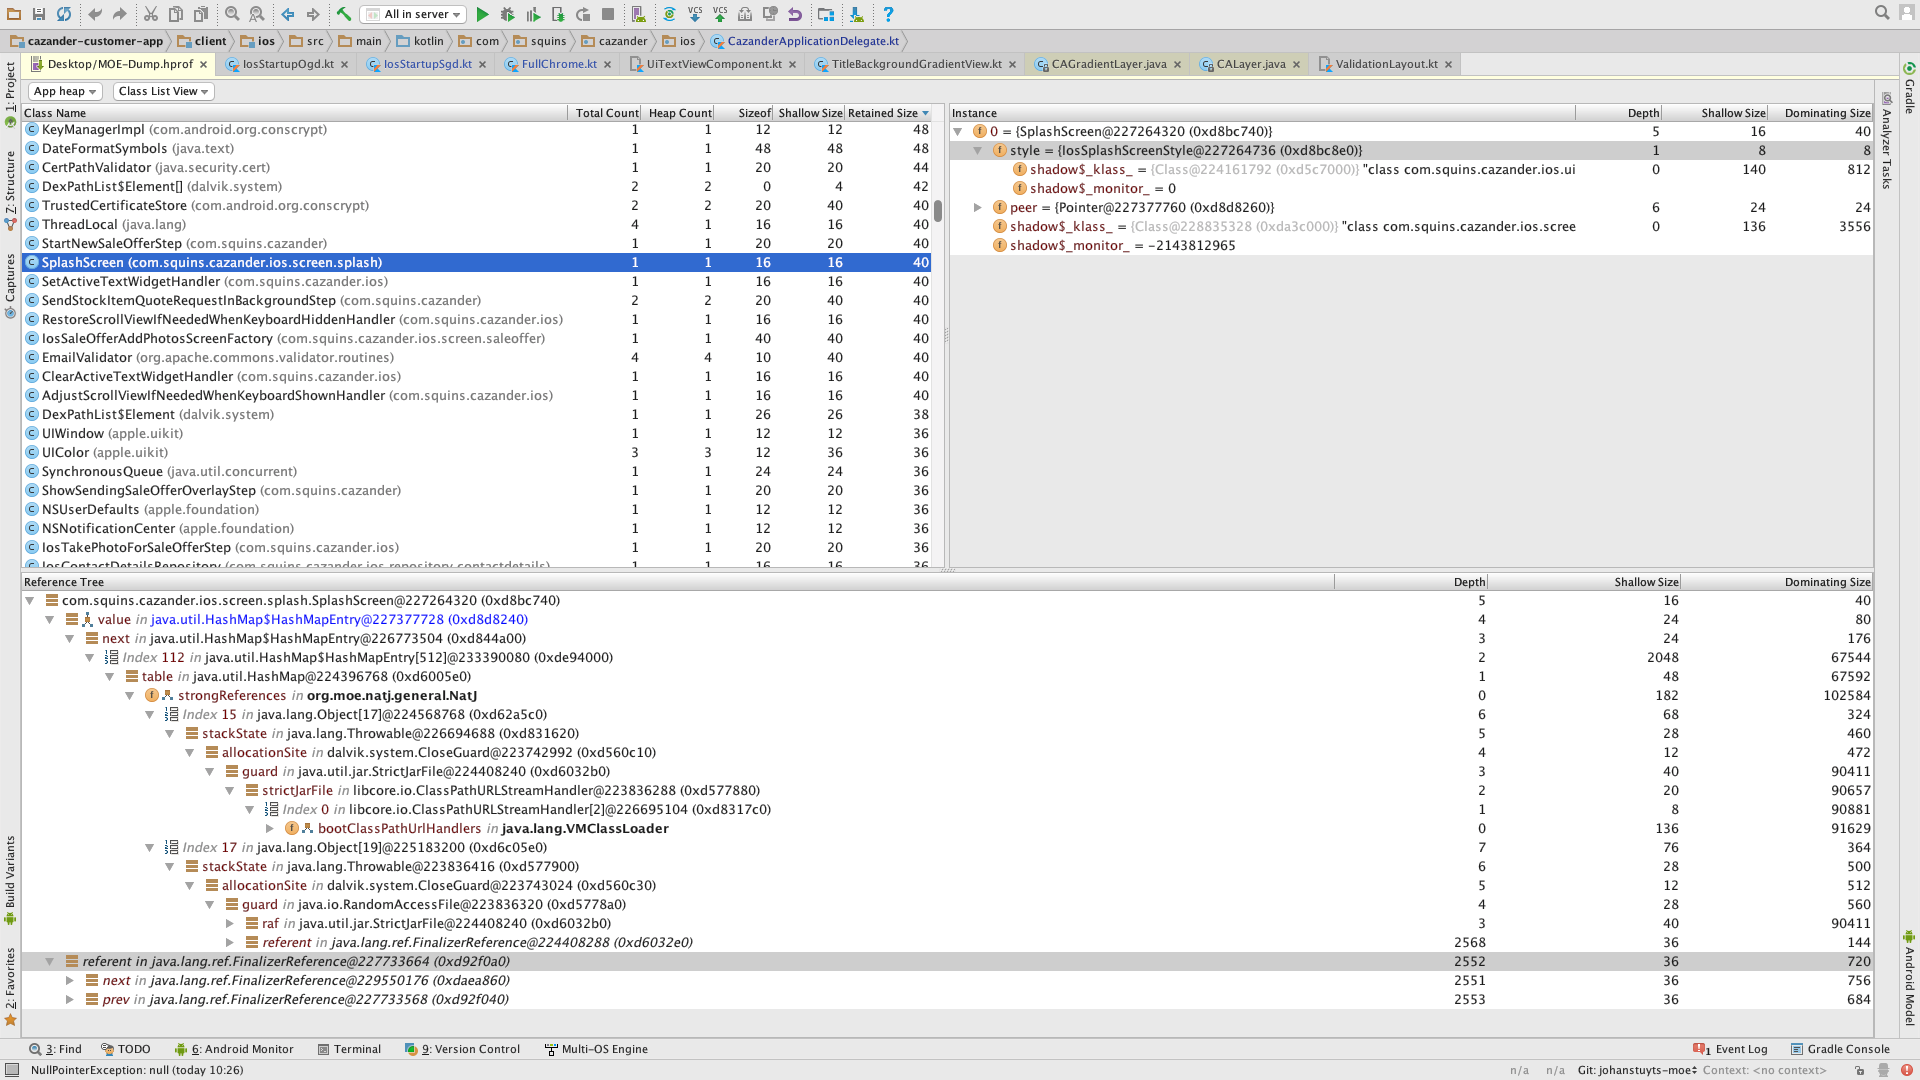
With the memory dump I was able to determine that my screens and associated views are not being garbage collected. I figured there must be a cycle in the reference counts on the iOS side, so I now dismantle the whole view tree in viewDidDisappear(Boolean) of my UIViewController. Unfortunately this does not seem to have an effect.
For example, I still see many instances of UIImageView. Many with no incoming references, or a combination of WeakReference and FinalizerReference references. The only outgoing references for this class are the peer pointer and some Kotlin-generated members.
What is preventing these views from being garbage collected?
Yes, I did. And using the generations feature I see that my memory is increasing.
The issues I have now is that I don’t understand why some JVM objects are not removed from memory (even though I perform a lot of forced garbage collections, which actually do remove a lot of objects). I am afraid that the JVM objects is what is keeping the iOS objects from being removed from memory.
If the amount of memory of the iOS objects is much bigger than the amount of memory of the JVM proxies, then it is possible that you run out of iOS memory before you run out of JVM memory. For example: Bitmaps can take dozens to hundreds of kilobytes of iOS memory, but their JVM counterparts may take up only a few 100 bytes. So a factor of 100-1000 times more iOS memory for a set of JVM objects is not unusual.
Suppose I have 100 kB of JVM objects, then I can have 100 MB of iOS objects. The JVM won’t remove the objects from memory because the JVM has plenty of heap space available. The app crashes/is killed because it consumes too much memory.
it is hard to see the issue without seeing the code. We would do the same as we suggest: use heap dump on the Java side and Instruments on the native side. One thing we would try to confirm is that the retain count of the stuck views is actually 1.
Nat/J’s logic is that when the retain count drops to 1, then it will replace its strong native Objc to Java reference with a WeakReference, because that last retain is actually the one held by the Java side, so when the finalizer frees that object, it will be released.
If you can confirm this, then the next place to check is whether the finalize() method of your ViewController Java object is actually called. If you follow up the inheritance chain, you will see that the finalize() in NativeObject will call the peer.release(), which will do the actual release of the native object. You should be able to follow it there to see if the release actually happens. (e.g. checking the retain count of the peer’s address in Xcode at the same time).
I have created a basic project that does some of the things my troublesome main project does: load images, scale them and put them in UIImageViews. I figured that would introduce the problem, but the memory usage stabilizes at some point. I am going to look further, and see if I can find a reproduction scenario.
No, I used the marking of generations of allocations profiling. This showed me an increase of about 3 MB per screen.
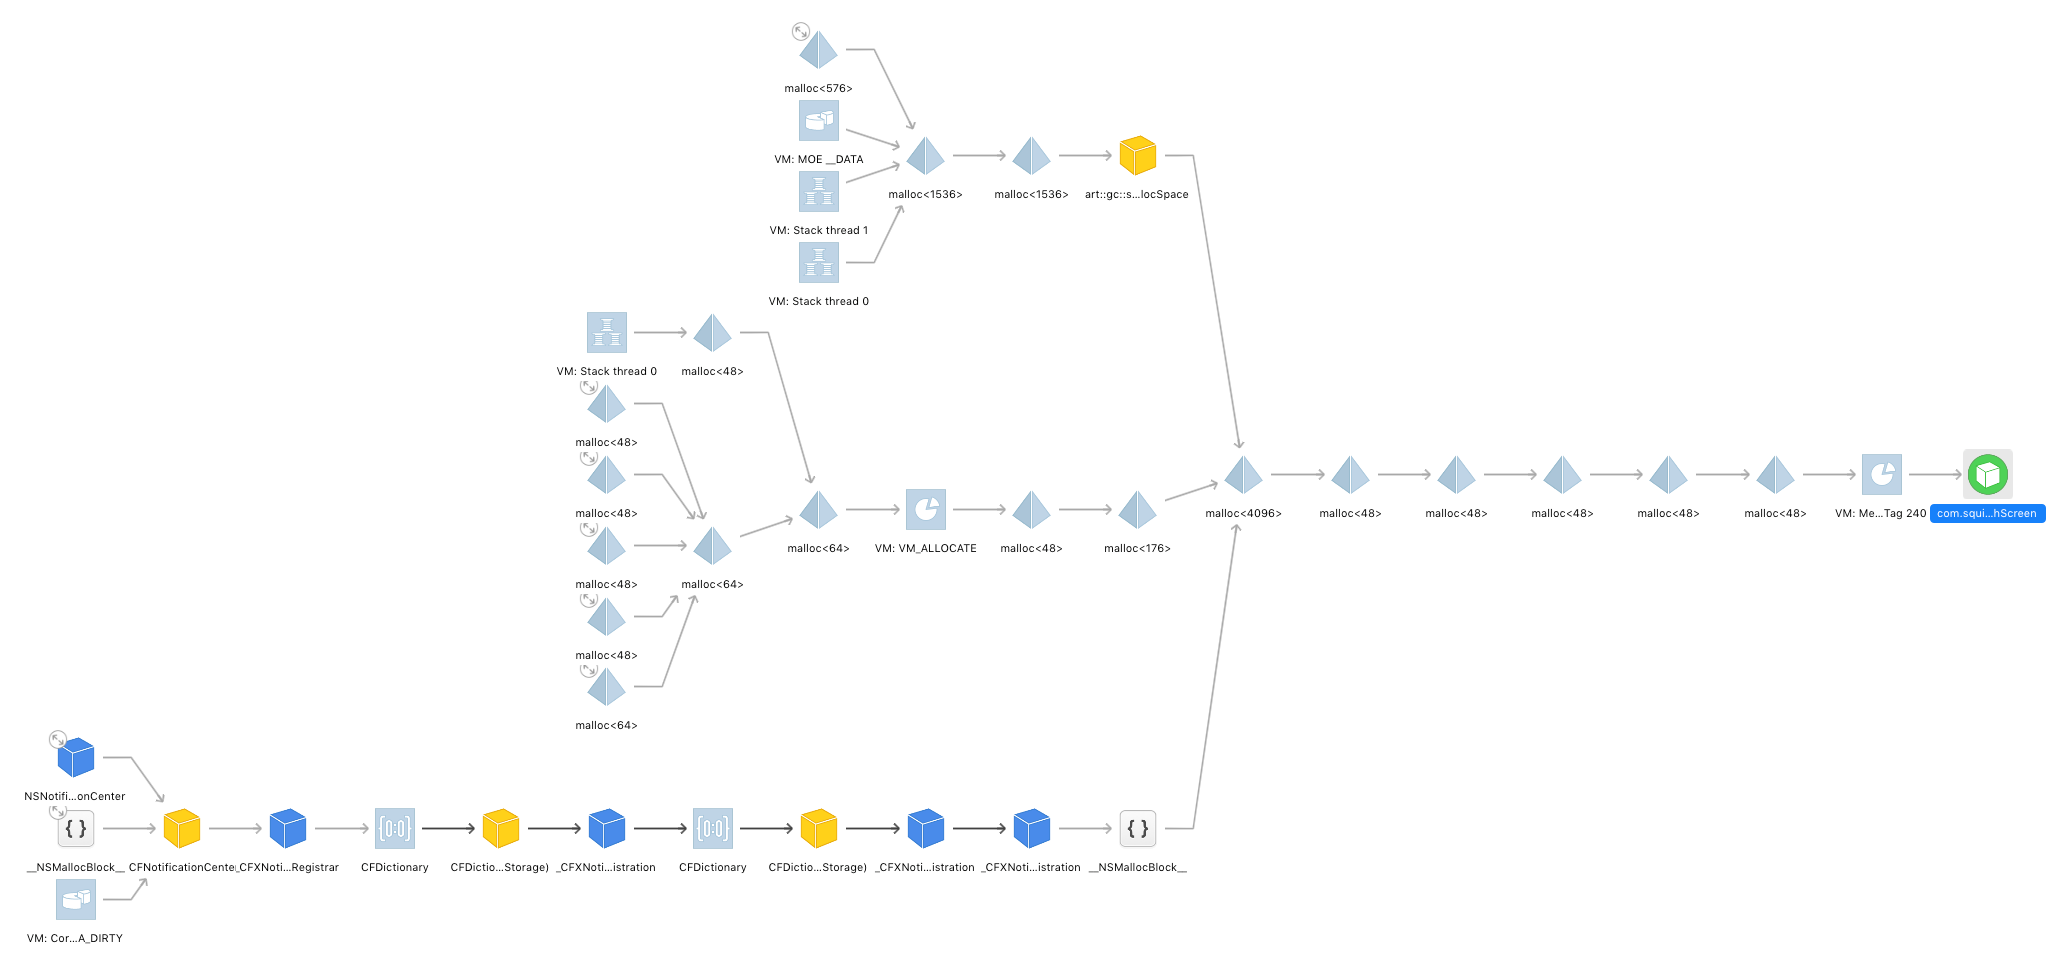
It looks very impressive, but there are so many memory tags and allocs, that I do not have a clue where the problem is.
Here are the backtraces of the first screen (a tree of views, image views and labels, without event listeners) that we show. I exercised the application a lot, during which there were many explicit garbage collection requests. But the first screen is still in memory after about a minute. I have no idea how the notification center got involved for this screen: