Hello Gergely,
I am very interested in finding a good solution and like to provide some detailed information about my findings. I will answer your questions in separate posts. All tests were executed within the following environment:
- Macbook Pro 2016, 4 core 2,6Ghz CPU, macOS 10.12.4
- XCode 8.3.2
- moe-gradle 1.3.6
- iPhone 7 Plus, iOS 10.3.1
RAM USAGE
Measured with the simplest possible app (New -> Project -> Java Single View Application).
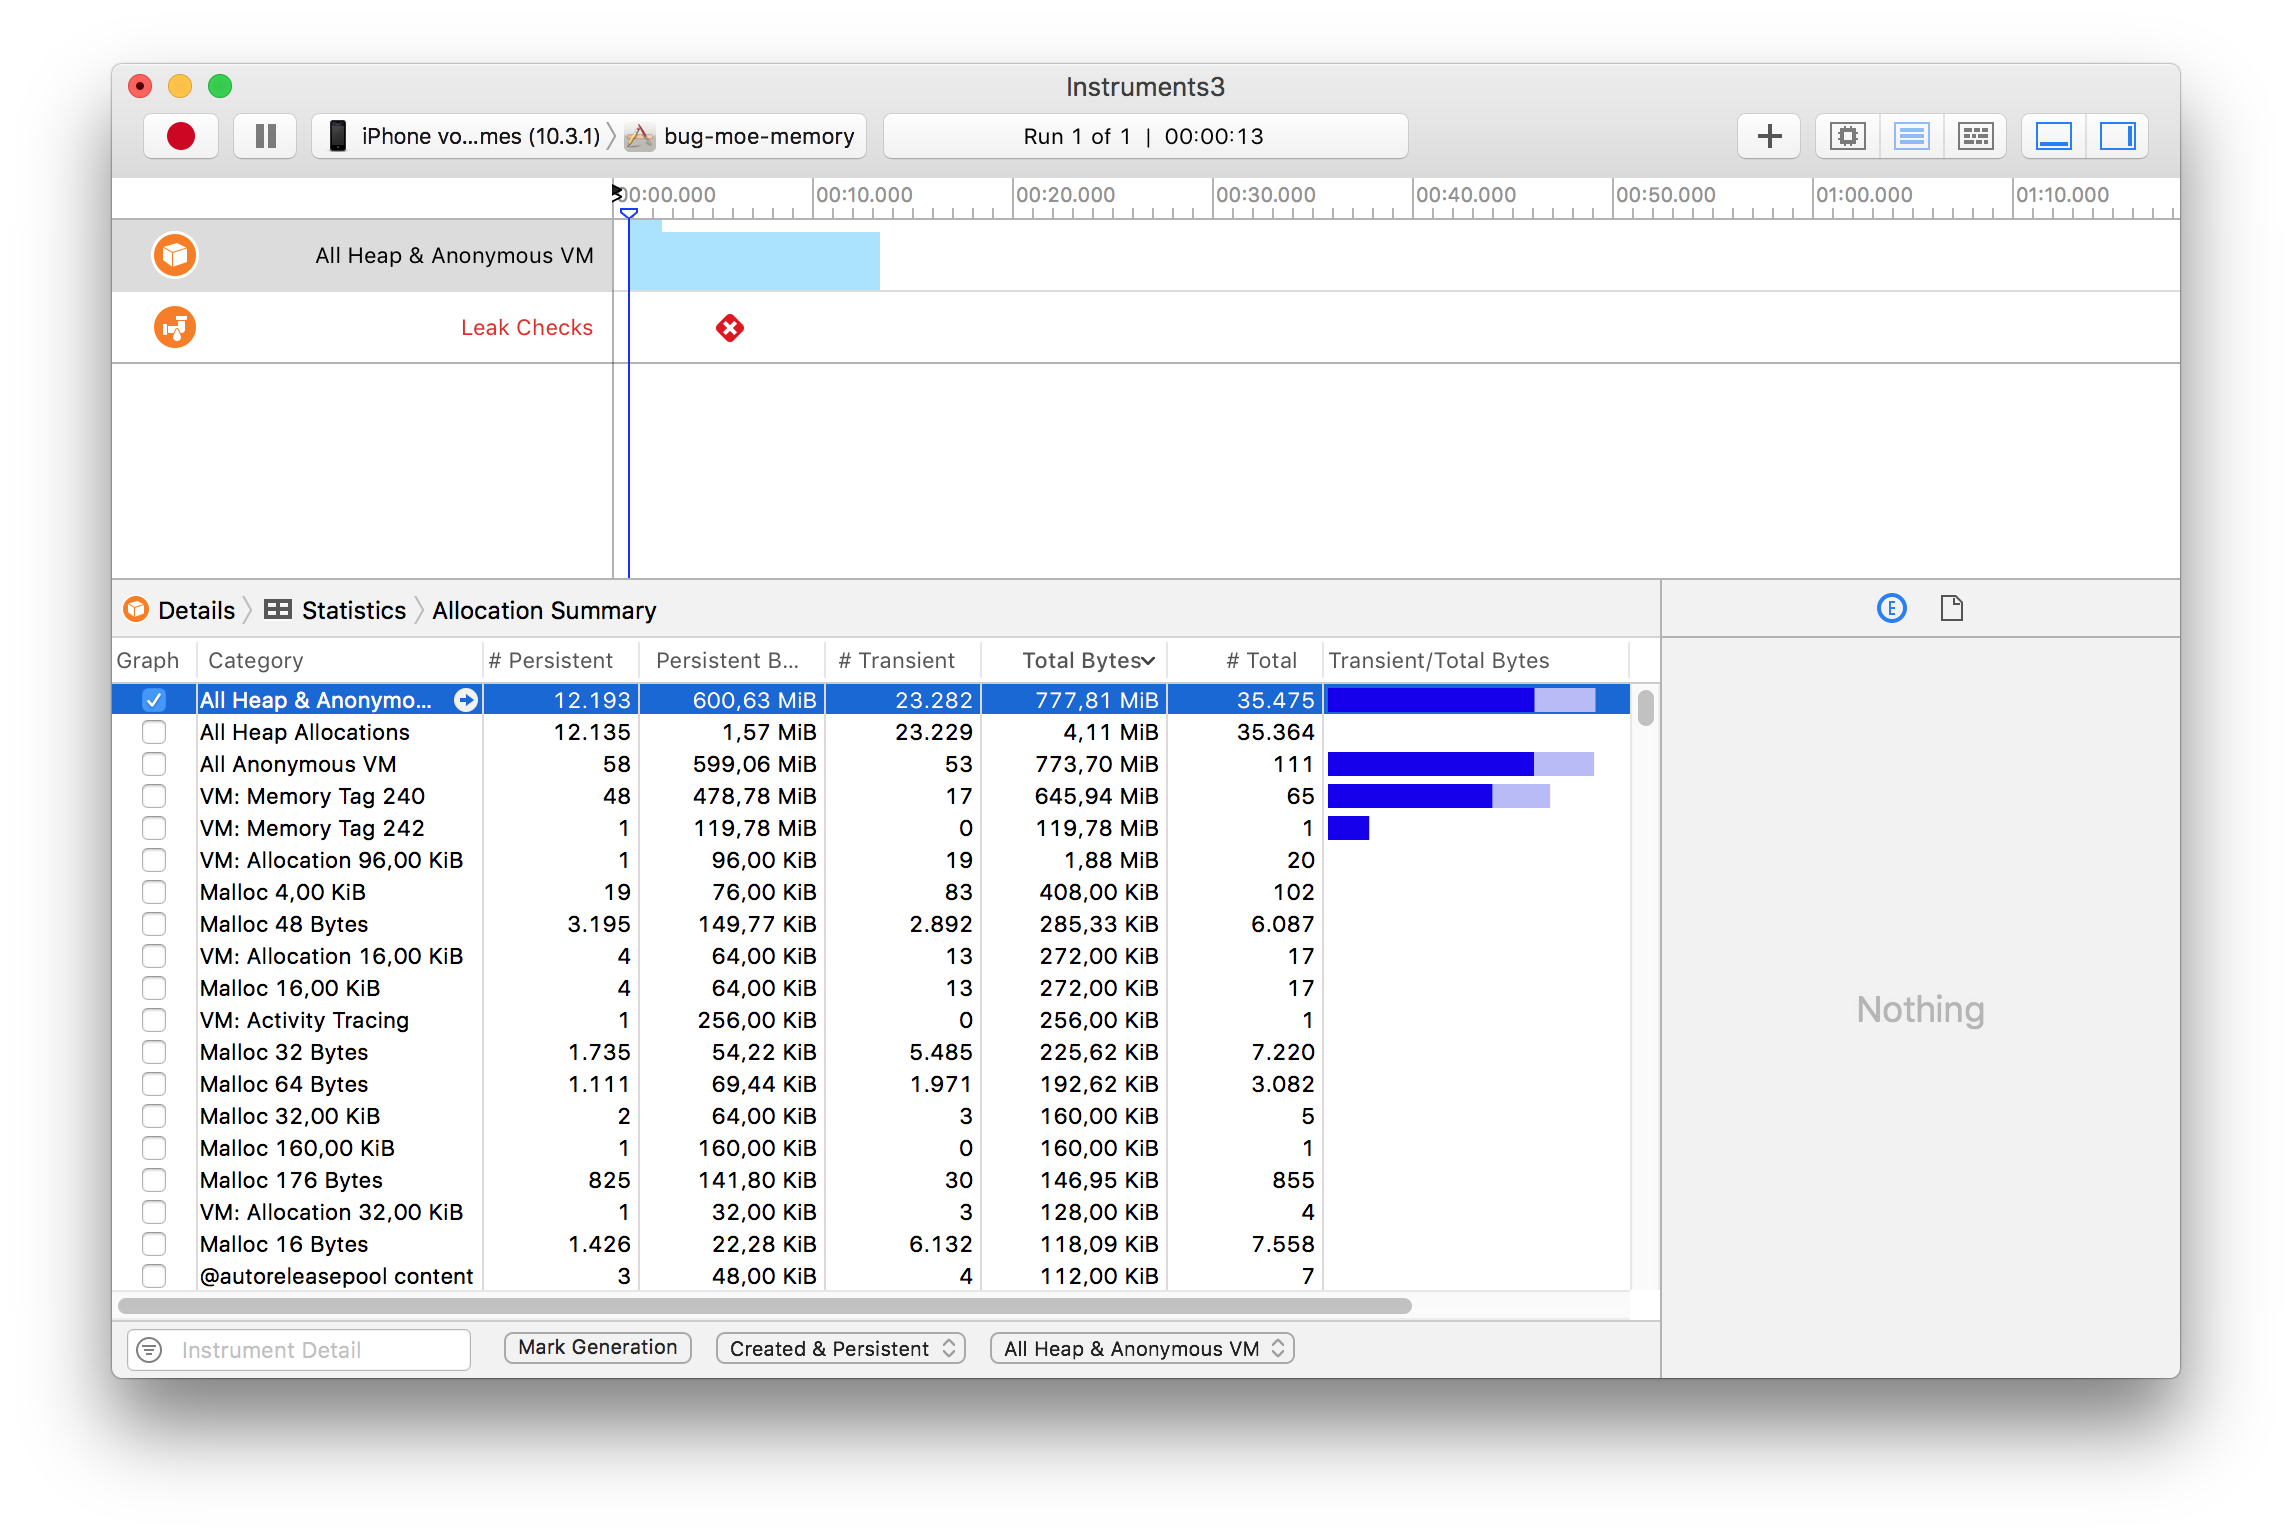
- MOE-app executed by opening the corresponding XCode-Project and running the app with Instruments’ “Leaks” setup. Both configurations (release and debug set in XCode’s project settings) showed more than 700 MB total memory and 600 MB persistent memory as shown below. Also, there were minor memory leaks within the startup phase:
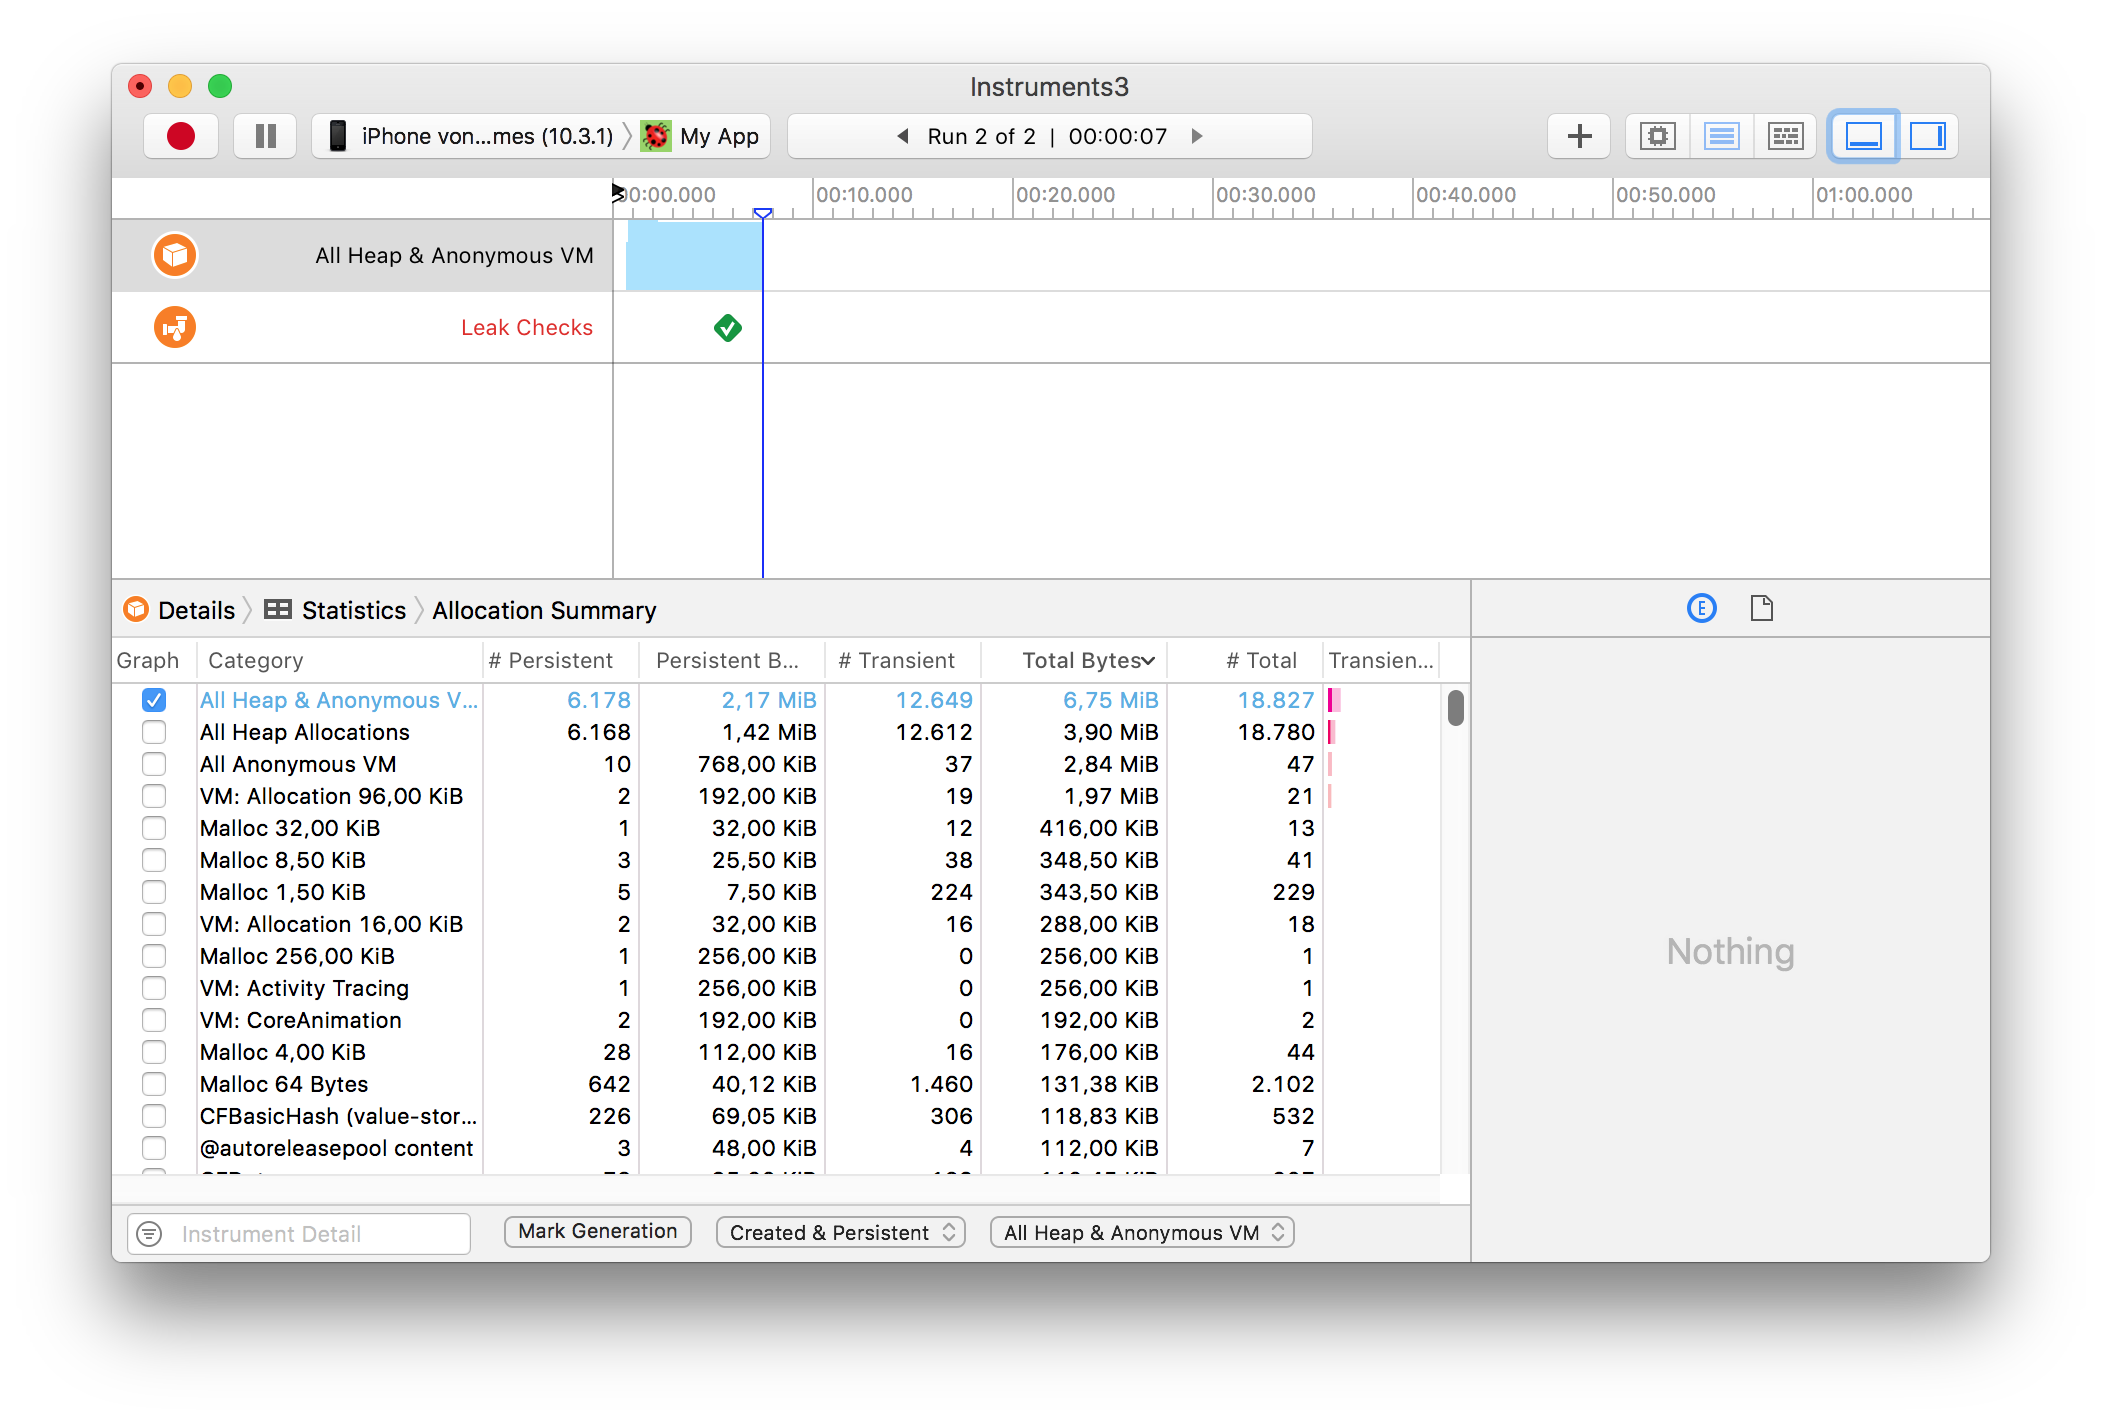
- For comparison: Running the Single View Application built with BugVM (aka RoboVM) resulted in 6.75 MB total memory and 2.17 MB persistent memory - no memory leaks:
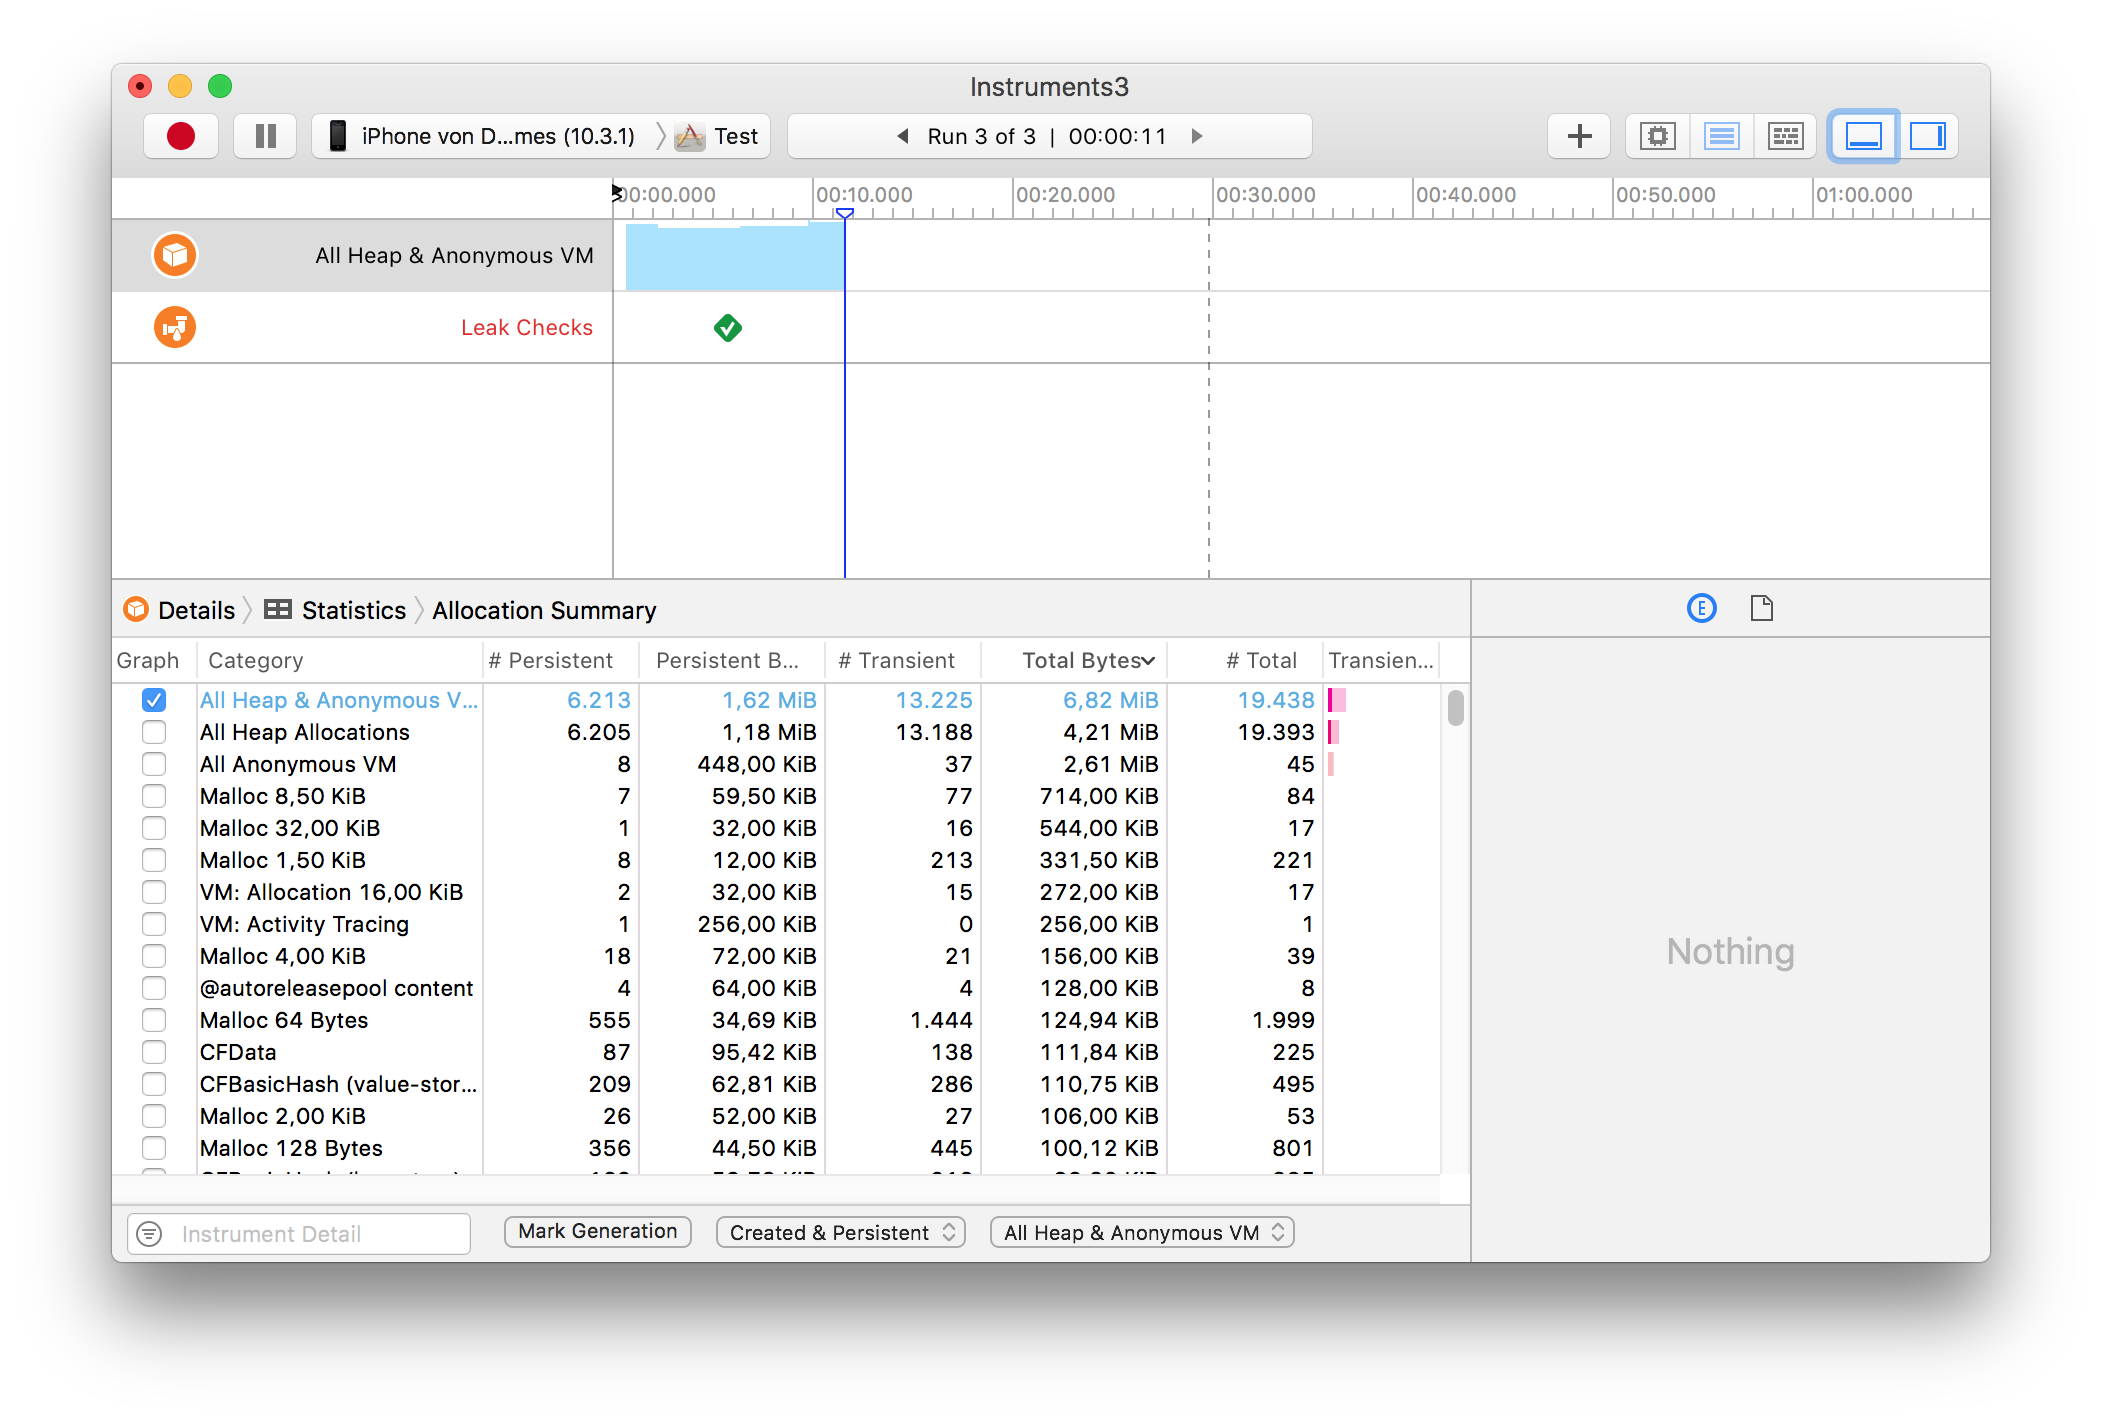
- For comparison: Running the Single View Application built with XCode and Swift resulted in 6.82 MB total memory and 1.62 MB persistent memory - no memory leaks:
If Instruments does not measure wrong, the RAM requirements of the MOE-app are currently a problem. Please point me to a better measurement method, if Instruments is the wrong tool here.