There is problem with our app, it sometimes have a long time to initialize. And Ios kill app with crash. I profile that and see
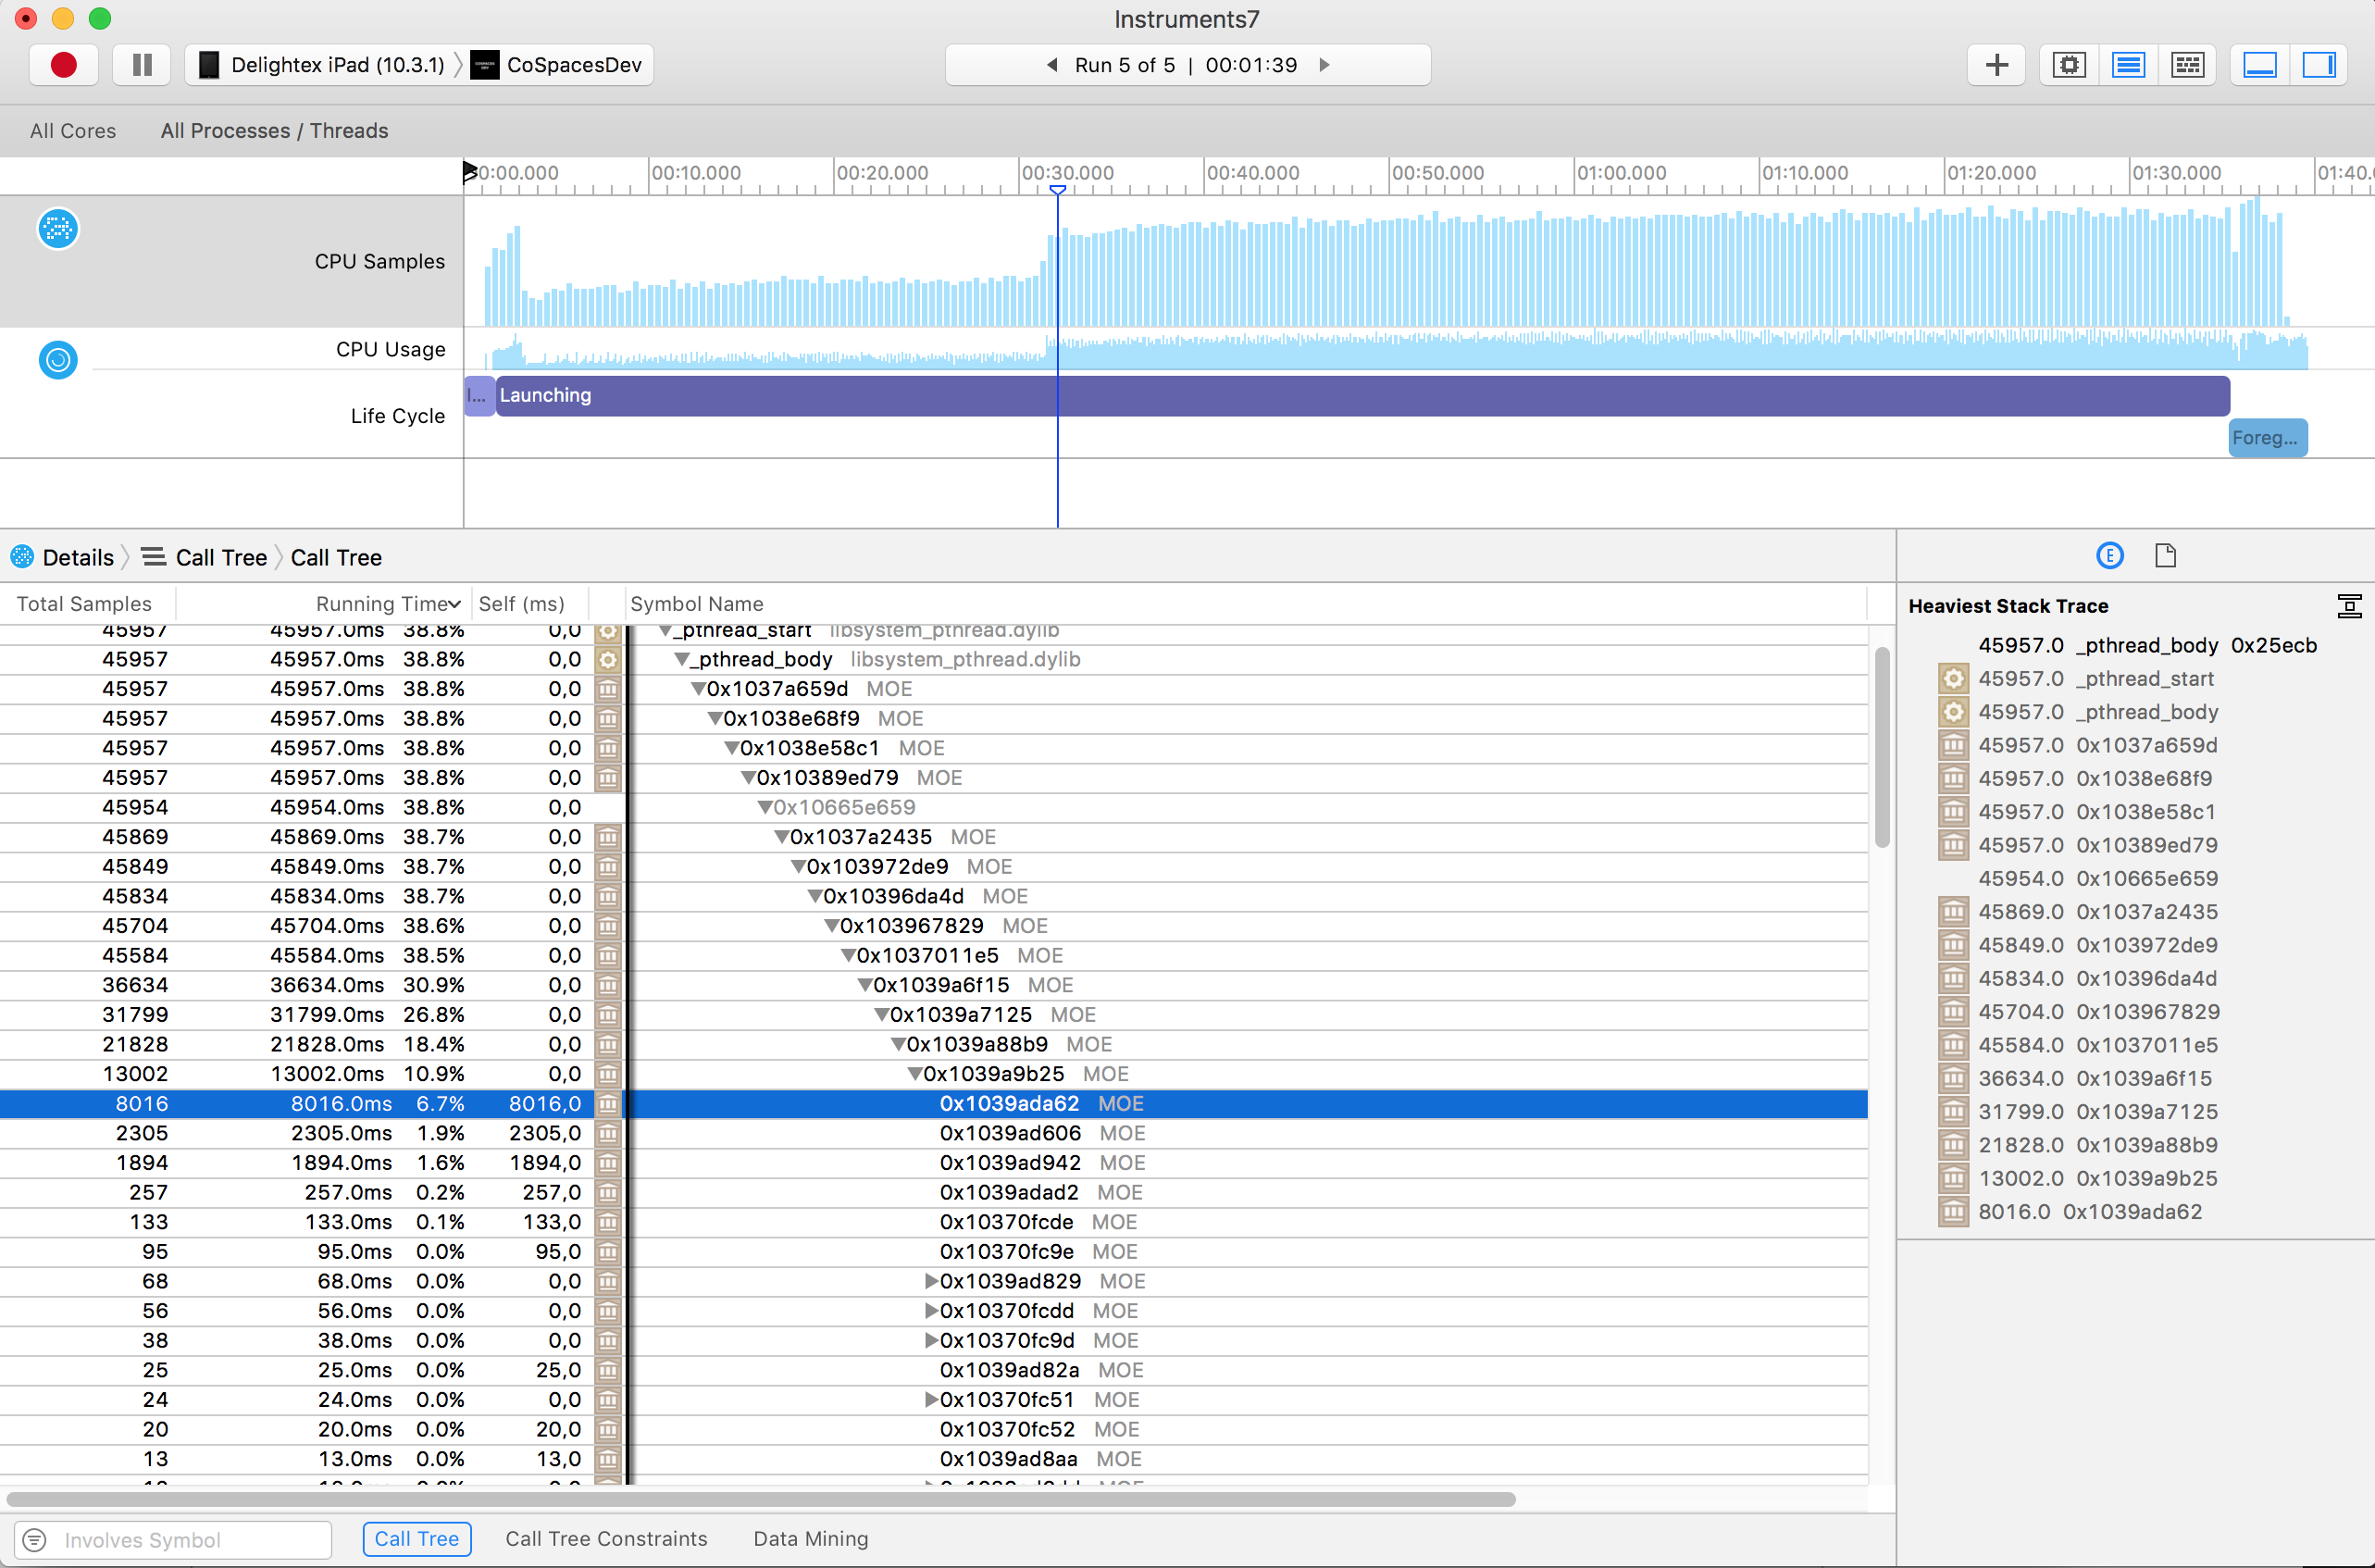
_pthread_start consumes 40% cpu. Can I locate which methods invoke that? Can I somehow deobfuscate that call tree?
For MOE 1.x this is not easy. One option is to try and enable method tracing on the Java side using the Dalvik VMDebug interface, then you can analyze that trace log. I am not sure if method tracing works correctly on the current MOE, we had some issues with it in the past.
For MOE 2.x, you will see the actual Java methods from the native side as well, so you will be able to use Instruments as you would with any native app. We are finalizing the first alpha of MOE 2.x, so you should be able to try this out real soon now.
3 Likes
Dear @kisg,
Hope this release helped us to release first version of our application.
Best Regards,
Saeed
Dear @kisg,
I have an problem on my build time too.
Is there any solution for reduce build time ?
Best Regards,
Saeed