Hi, I got an exception:
malloc: *** error for object 0x7fa474216fc0: pointer being freed was not allocated
*** set a breakpoint in malloc_error_break to debug
But I can’t understand how I can debug that?
Thank you
Hi, I got an exception:
malloc: *** error for object 0x7fa474216fc0: pointer being freed was not allocated
*** set a breakpoint in malloc_error_break to debug
But I can’t understand how I can debug that?
Thank you
Dear Ivan Bielko,
could you please start your app from Xcode and debug from there and add a symbolic breakpoint on malloc_error_break? We need more info on what caused this issue.
Here is Apple’s guide for debugging with Xcode:
Best Regards,
Kristóf
Log:
libsystem_c.dylib`__abort:
0x113d7cfb <+0>: pushq %rbp
0x113d7cfc <+1>: movq %rsp, %rbp
0x113d7cff <+4>: pushq %rbx
0x113d7d00 <+5>: subq $0x18, %rsp
0x113d7d04 <+9>: cmpq $0x0, 0x2b2fc(%rip) ; gCRAnnotations + 7
0x113d7d0c <+17>: jne 0x113d7d1c ; <+33>
0x113d7d0e <+19>: leaq 0x29674(%rip), %rax ; “__abort() called”
0x113d7d15 <+26>: movq %rax, 0x2b2ec(%rip) ; gCRAnnotations + 8
0x113d7d1c <+33>: movq $0x0, -0x18(%rbp)
0x113d7d24 <+41>: movl $0x0, -0xc(%rbp)
0x113d7d2b <+48>: leaq -0x10(%rbp), %rbx
0x113d7d2f <+52>: movl $0xffffffff, -0x10(%rbp) ; imm = 0xFFFFFFFF
0x113d7d36 <+59>: leaq -0x18(%rbp), %rsi
0x113d7d3a <+63>: movl $0x6, %edi
0x113d7d3f <+68>: xorl %edx, %edx
0x113d7d41 <+70>: callq 0x113fa884 ; symbol stub for: sigaction
0x113d7d46 <+75>: andb $-0x21, -0x10(%rbp)
0x113d7d4a <+79>: movl $0xffffffff, -0x1c(%rbp) ; imm = 0xFFFFFFFF
0x113d7d51 <+86>: leaq -0x1c(%rbp), %rsi
0x113d7d55 <+90>: movl $0x3, %edi
0x113d7d5a <+95>: xorl %edx, %edx
0x113d7d5c <+97>: callq 0x113fa416 ; symbol stub for: sigprocmask
0x113d7d61 <+102>: movl $0x1, %edi
0x113d7d66 <+107>: callq 0x113fa578 ; symbol stub for: __pthread_workqueue_setkill
0x113d7d6b <+112>: movl $0x3, %edi
0x113d7d70 <+117>: xorl %edx, %edx
0x113d7d72 <+119>: movq %rbx, %rsi
0x113d7d75 <+122>: callq 0x113fa5f6 ; symbol stub for: pthread_sigmask
0x113d7d7a <+127>: callq 0x113fa5e4 ; symbol stub for: pthread_self
0x113d7d7f <+132>: movl $0x6, %esi
0x113d7d84 <+137>: movq %rax, %rdi
0x113d7d87 <+140>: callq 0x113fa5a2 ; symbol stub for: pthread_kill
0x113d7d8c <+145>: movl $0x2710, %edi ; imm = 0x2710
0x113d7d91 <+150>: callq 0x113fabf6 ; symbol stub for: usleep$NOCANCEL
0x113d7d96 <+155>: movl $0xffffffe7, -0x10(%rbp) ; imm = 0xFFFFFFE7
0x113d7d9d <+162>: movl $0x3, %edi
0x113d7da2 <+167>: xorl %edx, %edx
0x113d7da4 <+169>: movq %rbx, %rsi
0x113d7da7 <+172>: callq 0x113fa416 ; symbol stub for: sigprocmask
-> 0x113d7dac <+177>: ud2
Dear Ivan Bielko,
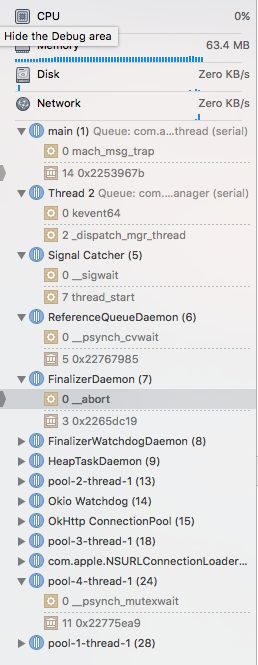
could you please send a screenshot of the process view?
Best Regards,
Kristóf
Dear Ivan Bielko,
this means that the finalizer daemon is running code that is trying to free something that is already freed. Using Ptrs incorrectly can be the cause of this.
A common mistake is when Ptr object takes ownership of memory which it should not take ownership of. Mainly caused by using strong variants of Ptrs instead of weak. You can read more about this here.
If you want to get more info on the double released memory, you can use address sanitizer to check it.
Best Regards,
Kristóf
But with robo vm it works with out exceptions.
Dear Ivan Bielko,
different memory management, different APIs, etc. Do you know which code is causing the crash?
Best Regards,
Kristóf
Actually no, I am trying find that.
Without a symbolicated stack trace or access to the project it is hard to say what causes the problem.
There are a lot of differences between ART and RoboVM. For example ART is much more strict about the JNI standard compared to RoboVM (or Dalvik for that matter). So it is perfectly possible that some code runs on RoboVM but not on ART / MOE.
How can I symbolicate MOE generated code ?
Found out that exception appears in different times. Could it be caused not by my code but by sdk?
You cannot symbolicate generated code, but if you build a debug SDK from source, and use that, then you will at least see the C++ symbols.
In MOE 2.0 even the generated code from Java will be fully symbolicated in crash logs (except for inlined code of course).
It is possible that you hit a MOE bug, but without access to the code we can’t be sure.